As a member of the BlogPaws community, I am also a member of the Pet Blogger Influencer Group. We participate in monthly blogger surveys (which I find really exciting and I love seeing an email notification for a new survey!) and January’s results are in. The results were made into a super fun infographic, and I’d like to share it with you all so you can get further insight into the blogging world!
What do these stats mean to me?
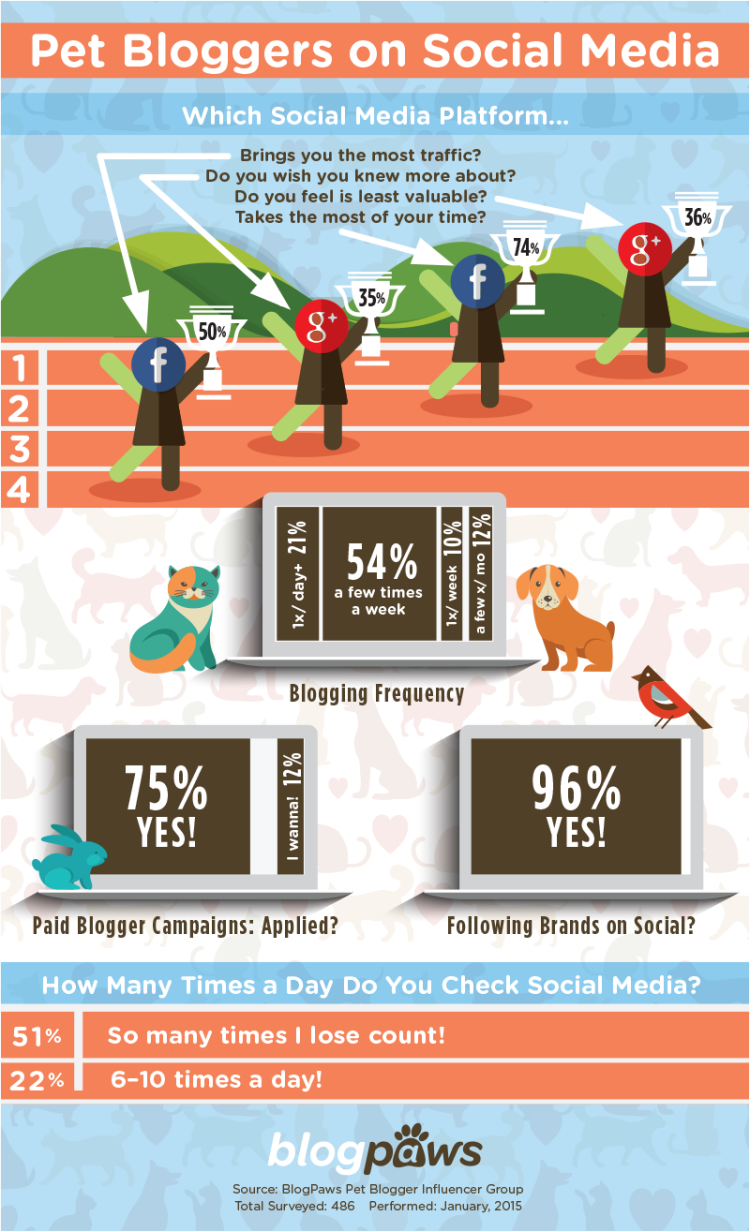
- Just like 50% of influencers in this survey, Facebook does indeed bring the most traffic to my blog. I have almost 10,000 Facebook followers.
- I also wish I knew more about Google+, as do 35% of survey takers.
- A whopping 74% said Facebook is the least valuable to them. For me, it’s the MOST valuable!
- In terms of taking the most of our time, 36% said Google+. For me, this would be Facebook because I post about 3-7 times per day, and it brings me the most traffic, and therefore I put the most time into it.
- Along with 54% of survey takers, I blog a few times a week.
- I am with the 75% who apply for paid campaigns, but only if I believe in them and if I think they’d be a good fit for my blog.
- I definitely follow brands on social media. I think it’s important to follow pet companies that I love in order to stay up on the latest and greatest!
- And last but not least – how many times a day do I check social media!! I’m definitely one of those “So many times I lose count!” people. No shame!
What do you think about this infographic?